
The spreadsheets, the graphs and all of those countless numbers – data can feel so painfully boring at times. But from performance reviews and marketing strategies to financial projections, data is essential for the growth and success of any business.
So how can you share the valuable data that your employees, customers and investors care about without those yawn-inducing presentations?
The answer: show them a visual story.
The Power of Data-Driven Storytelling
Simply, data-driven storytelling is the ability to transform raw data into a visual narrative that is easy to communicate and easy to understand.
Now you might be asking, aren’t bar graphs and pie charts visual ways of showing data? They absolutely are, but they don’t tell a story.
Data-driven storytelling focuses more on the narrative structure of the visual elements. Think: infographics, dashboards, videos and other visual elements that can take data and simple language and transform it all into a compelling story that illustrates all of the important facts your employees, customers and investors need to know, such as metrics, statistics and trends.
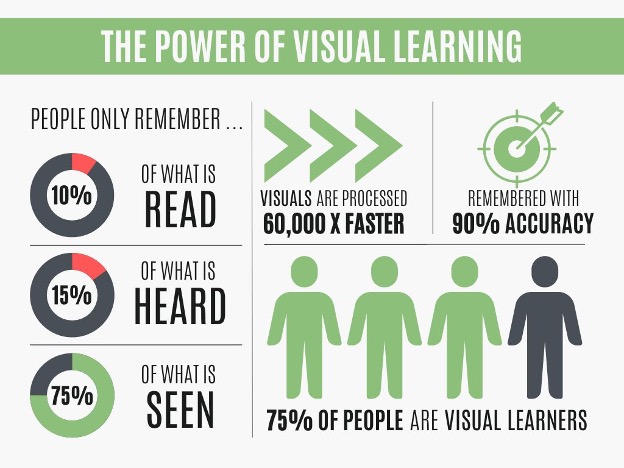
Some people may dismiss the value of data-driven storytelling because they believe that people want straightforward information without any visual stuff getting in the way. Well, the truth is that people actually learn and remember more effectively with visuals. Take a look at the infographic below and see for yourself. (You didn’t think we would talk about data-driven storytelling without including data-driven storytelling, right?)
With all of this data about the advantages of visual learning, it’s hard to argue the power of data-driven storytelling. In fact, many companies are using it to present their data.
Most notably, Spotify has gained popularity with their Spotify Wrapped data-driven storytelling that has actually become a viral marketing campaign. Towards the end of every year, Spotify users seemingly rush to be the first to post their Spotify Wrapped on their social media accounts.
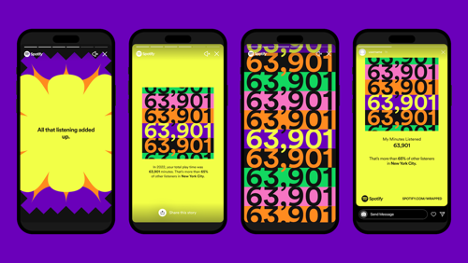
Spotify Wrapped creatively displays a range of different metrics, including hours listened, most played genres, number one played song, and so much more. They even go as far as to provide users with a listening personality that is also based on streaming data. But Spotify isn’t the only company taking advantage of data-driven storytelling.
Of course, Google, being the leader of data innovation that it is, goes above and beyond with its thought-provoking Year in Search videos, an excellent example of how creative data-driven storytelling can become.
Google’s Year in Search artfully loads a ton of data about trends into a visual narrative. The most impressive part about Google’s approach is that it doesn’t actually feel like they’re presenting data. It just feels like a compelling story that is not only easy to watch and understand but also inspiring.
Make Data Compelling, Not Boring
As you can imagine, it’s easier for companies to use traditional ways of presenting data, like those mind-numbing spreadsheets. It’s simple, fast and cost-effective. There’s no doubt about that. But what’s the point of presenting important data when your audience is too focused on trying not to fall asleep than actually paying attention?
Whether it’s as simple as sharing a basic metric or as complex as a full-year analytics report, it’s visually clear that data-driven storytelling is the most effective, compelling and memorable way to present data.
If you’re tired of making your audience fall asleep with those data-crammed presentations and want to experience the power of data-driven storytelling, reach out to the storytelling experts at DeanHouston+.